
View Details
River North
Anchor Retail
River North Plaza
340 W. Hubbard St., Chicago, IL 60654
Occupied
62,400 SF
Total SF
1,872 SF
Available SF
$31.20
NOI/SF
We match raw square footage with the right tenant mix — until a half-empty strip mall hums like a neighborhood again.
4.2M
SF Under Management
94.7%
Portfolio Occupancy
38
Managed Properties
Scroll
Managed Portfolio
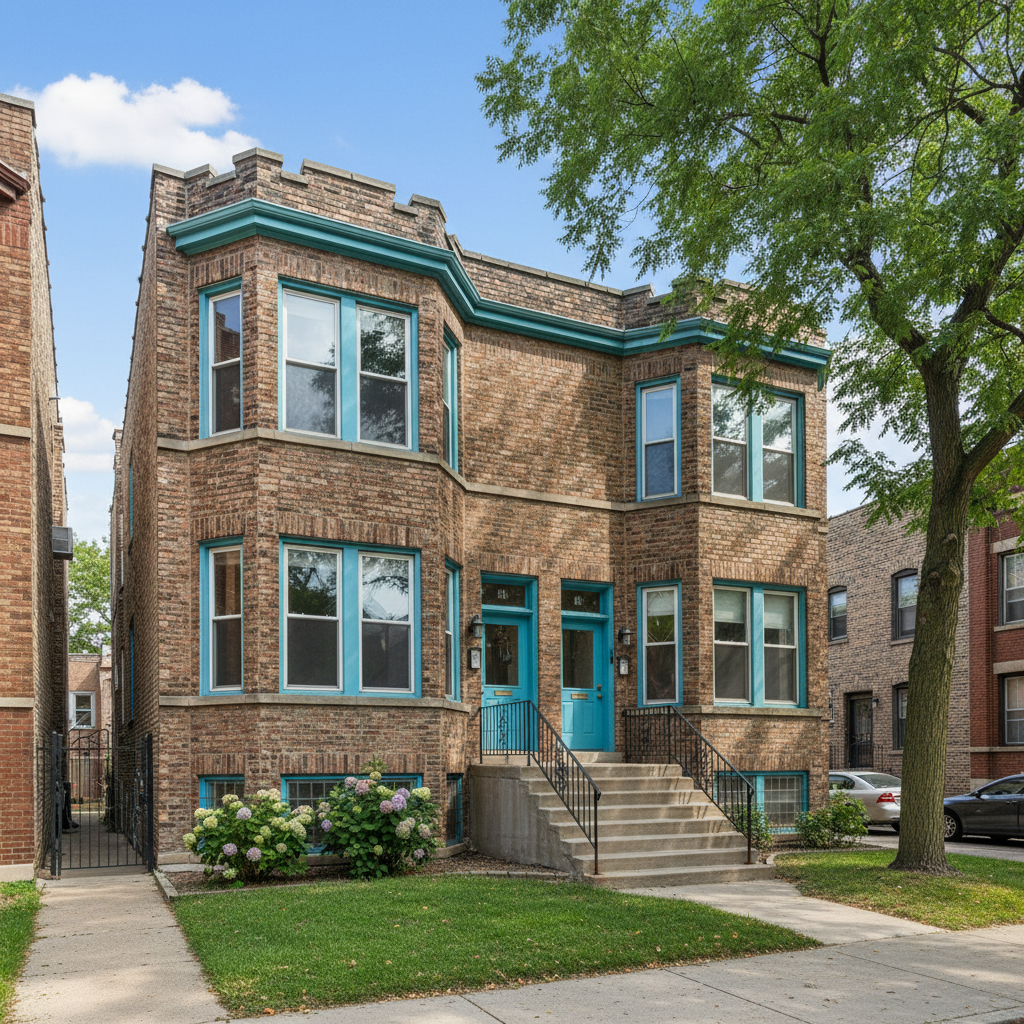
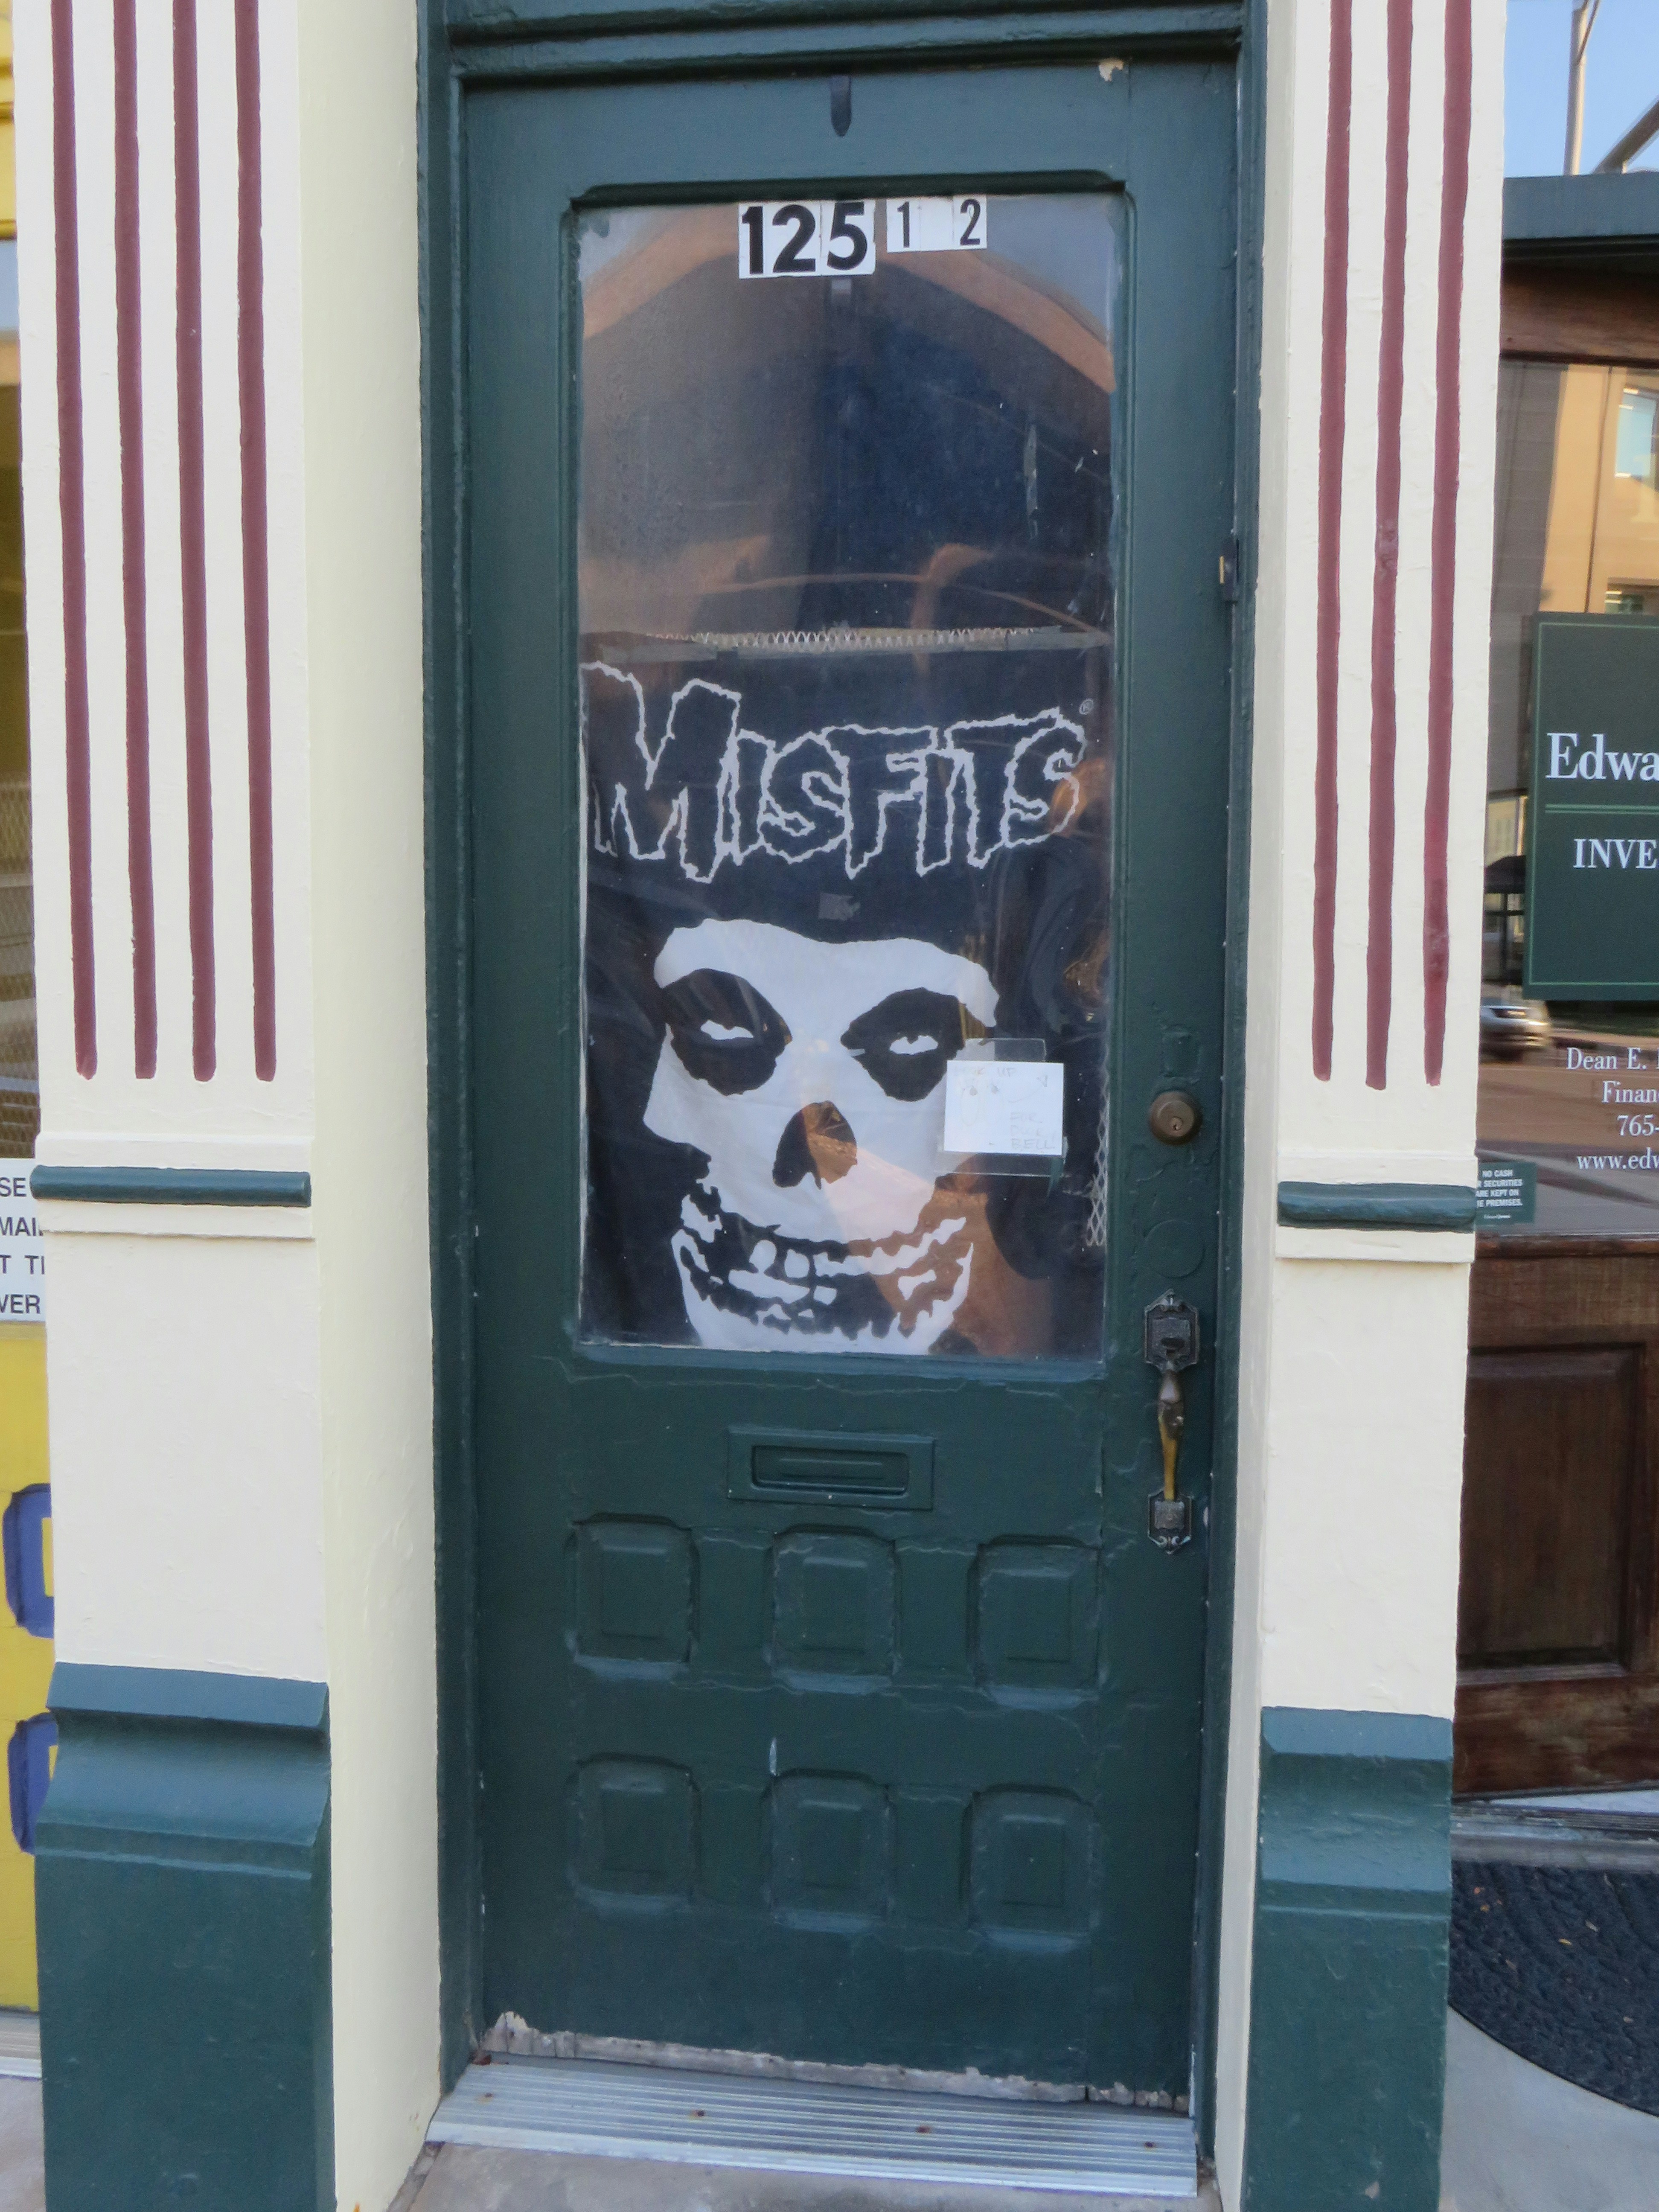
Each property is shot, measured, and staged for the right tenant — not just any tenant.
340 W. Hubbard St., Chicago, IL 60654
62,400 SF
Total SF
1,872 SF
Available SF
$31.20
NOI/SF
2140 N. Halsted St., Chicago, IL 60614
38,200 SF
Total SF
3,438 SF
Available SF
$27.80
NOI/SF

1008 W. Randolph St., Chicago, IL 60607
24,800 SF
Total SF
0 SF
Available SF
$38.50
NOI/SF
1550 N. Milwaukee Ave., Chicago, IL 60622
31,600 SF
Total SF
3,792 SF
Available SF
$24.60
NOI/SF

1215 S. Michigan Ave., Chicago, IL 60605
84,000 SF
Total SF
15,120 SF
Available SF
$22.40
NOI/SF
55 E. Monroe St., Chicago, IL 60603
42,600 SF
Total SF
2,130 SF
Available SF
$34.80
NOI/SF

820 W. Fulton Market, Chicago, IL 60607
18,400 SF
Total SF
1,288 SF
Available SF
$42.10
NOI/SF
1440 N. Wells St., Chicago, IL 60610
26,800 SF
Total SF
2,948 SF
Available SF
$26.20
NOI/SF

5210 N. Clark St., Chicago, IL 60640
19,600 SF
Total SF
2,744 SF
Available SF
$21.80
NOI/SF
Occupancy Math
Before we ask for anything, we show you what operational command looks like across a managed portfolio.
Under Management
Across 38 properties in 6 Chicago submarkets
Portfolio Occupancy
vs. 87.2% Chicago market average
Average NOI
18% above submarket benchmark
Avg. Lease-Up Time
From vacancy listing to signed LOI
Occupancy Benchmark
Lease-managed vs. Chicago Market Average
Q4 2025 — CBRE Market Report baseline
Client Results
REIT managers, developers, and institutional owners who needed vacancies filled — not managed.
"We handed Lease three anchor vacancies in our River North corridor that had been dark for 14 months. Within a quarter, all three were signed. Our NOI per square foot moved from $21.80 to $29.60 in a single leasing cycle."

Margaret Kowalski
VP Asset Management
Meridian Retail REIT
"Our construction loan clock was running on a 60,000 SF lifestyle center in Lincoln Park. Lease had 78% pre-leased before we topped out. The lender extended our rate — that alone covered three years of management fees."

David Okafor
Principal, Development
Lakefront Capital Group
"I've benchmarked four national leasing firms. None of them could show me traffic count data, co-tenancy modeling, and a signed LOI in the same 90-day window. Lease can. They move like operators, not brokers."

Patricia Nguyen
Director of Leasing
Eastbridge Property Group

Scale Signal
We've run this playbook across 38 properties. The pattern holds: targeted tenant recruitment, co-tenancy modeling, and NOI benchmarking — every time, in every submarket.
Request Leasing PackageLeasing Intake
Tell us about your asset. We'll respond within one business day with a preliminary vacancy analysis.